Inside a Google Ads performance report
Search and Performance Max, viewed through clicks, cost and conversion reporting.
Screenshot: October 3 – November 1, 2025 (30 days)
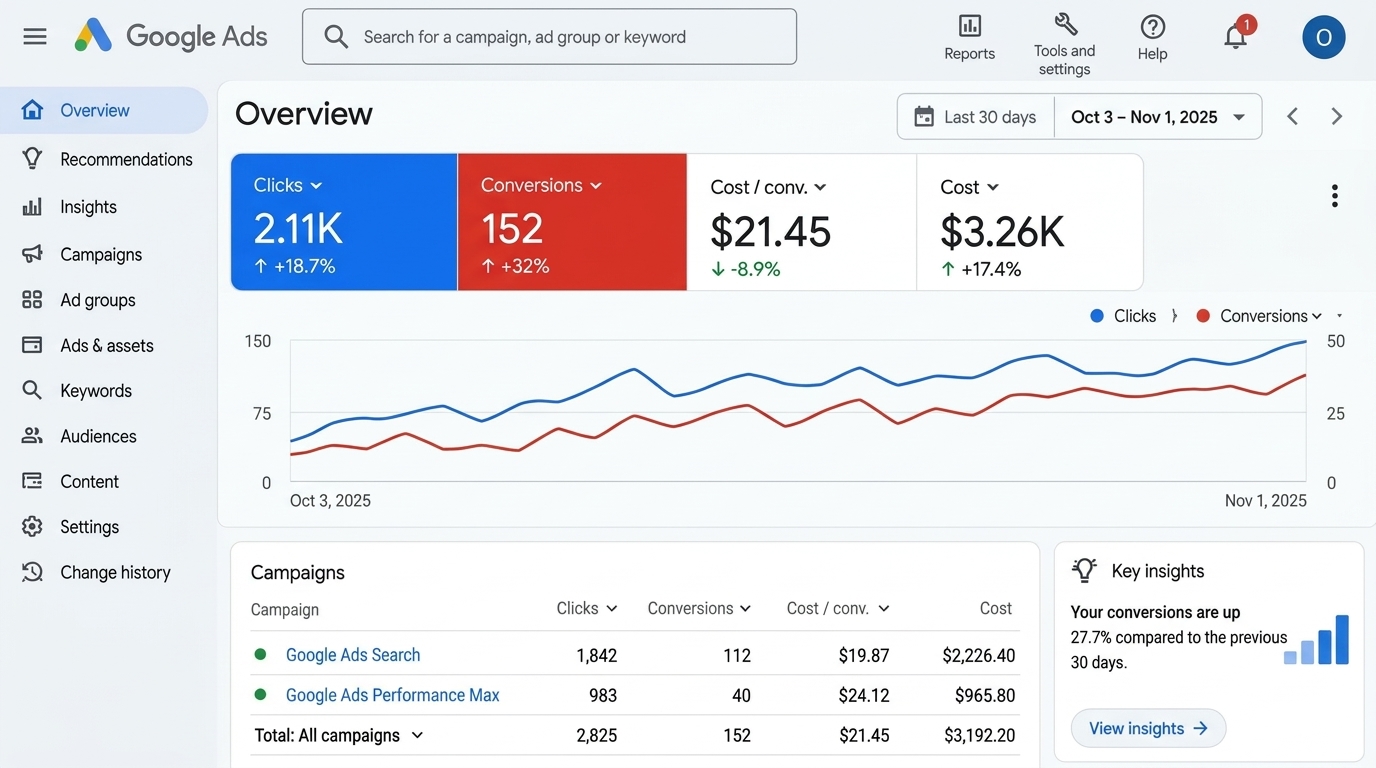
Source supplied for portfolio review. The overview and campaign table show different click and spend totals. Conversion action, currency, attribution, industry and client permission have not been confirmed. These are screenshot figures, not verified sales or an authenticated client achievement.
- 152
- Reported conversions
- 2.11K
- Overview clicks
- $3.26K
- Overview spend
- $21.45
- Cost / conversion
Objective & challenge
Understand the signal.
Assess the relationship between traffic, spend and reported conversion actions.
Client industry, publication permission, conversion value and ROAS are not supplied. No assumptions are made about sales, revenue or campaign ownership.
Strategy & implementation context
A recommended review would reconcile reporting scope, validate conversion actions and evaluate Search and Performance Max separately. Implementation details have not been supplied.
Lesson & recommendation
Reconcile totals and define a conversion before using platform reports to make budget decisions.
Your next chapter
Let’s build something
worth growing.
A new store, a better website, a clearer growth strategy.